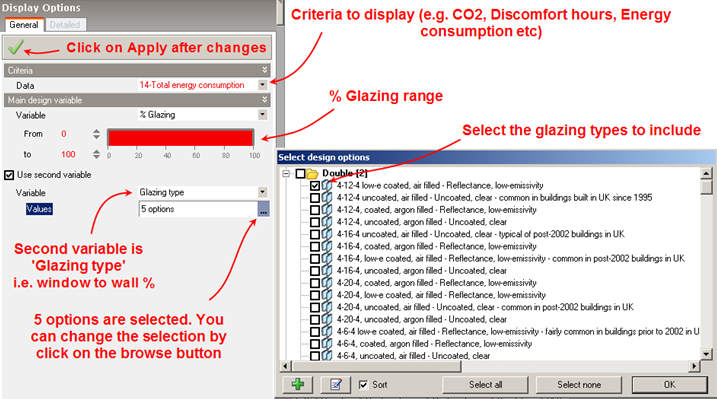
DesignBuilder can automatically run multiple simulations automatically adjusting up to 2 variables to create design curves. Design curves can be very useful at conceptual stages of the design process to understand how building performance is affected by variations. DesignBuilder allows you to generate curves to show how performance parameters like carbon emissions and comfort vary as key elements of the building design vary. You can select up to 2 design variables. For example you might want to plot the cooling energy consumption for the base design with a range of window to wall % and glazing types variations. The selection of the design variables is done in the Display options panel in the bottom left of the Simulation screen. Click on the Parametric tab to carry out parametric simulations. See below.
The design curves are generated by automatically running multiple simulations of the base design (i.e. the model defined on the edit screen) with variations applied at the building level.It is important to take into account how this data will be inherited to down to blocks, zones etc to ensure you are testing the design variants you think you are. For example if the Window to wall % was hard set at block level then changes in this data at building level would not influence the surfaces of the design variants and the results will indicate that the Window to wall % does not influence results (see Troubleshooting below).
Because there is no visual check on the state of the design variants the parametric function would normally be carried out on:
Parametric simulation results are stored with a record of the change made to the base case to create it and this allows new variants to be added to the study without invalidating previous results.
The number of design variants that are tested for 2 variable tests is the number of variants for the first variable multiplied by the number for the second variable. The variations in the above example would be different combinations of Glazing type and Window to wall %. In all, 6 x 5 = 30 simulations would be required to generate the design curves in this example.
Tip: Parametric simulations can take a long time to complete and DesignBuilder can keep grabbing focus away from the window you are working in as it refreshes the progress bar. To avoid this you can minimise the main DesignBuilder window. If you have a dual core processor, you should now be able to continue working while the simulations continue.
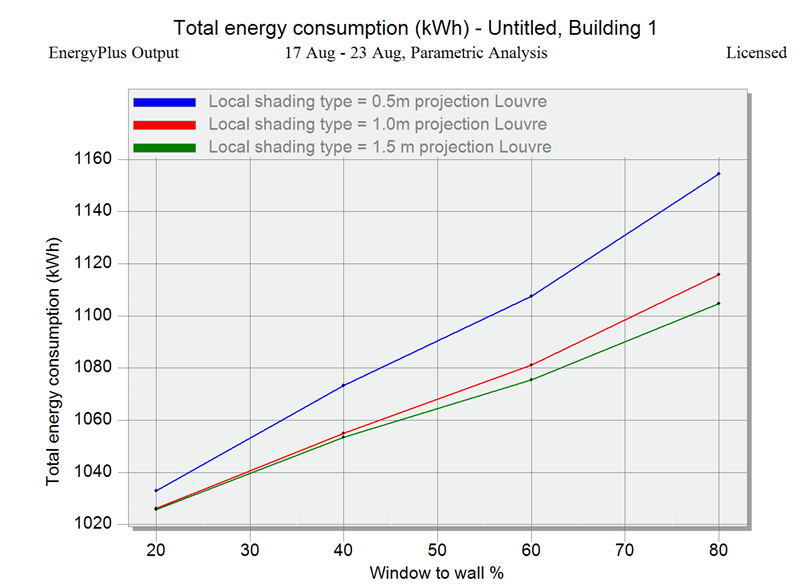
The graph above shows the diminishing returns with extra louvre projection from 0.5m to 1.5m.
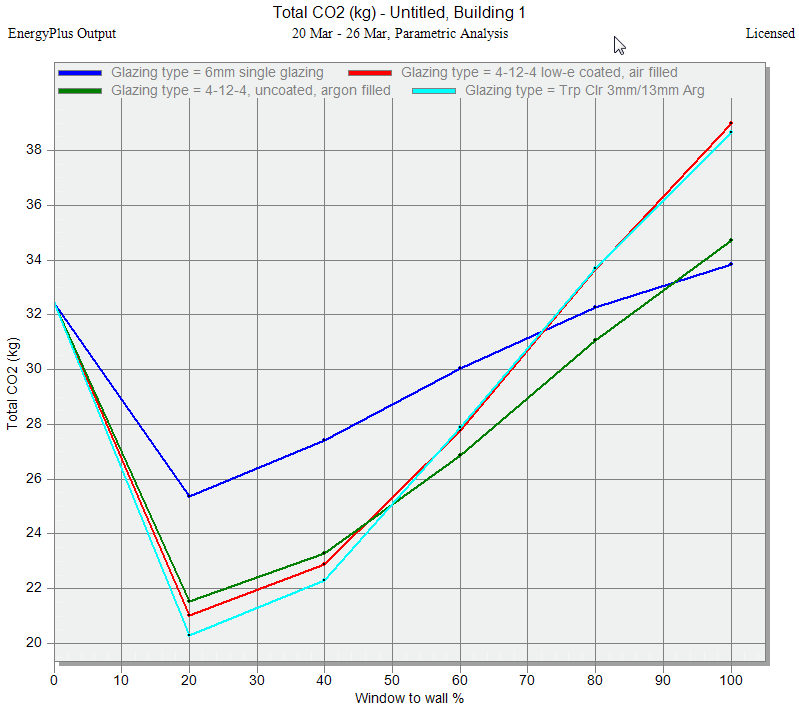
The image above shows a parametric analysis of total annual carbon emissions where glazing percentage is varied in a building with lighting control, heating and cooling for 4 different glazing types. It illustrates how optimum configurations can be identified using this approach.
Typical uses for parametric simulation are:
A common question from beginners with the parametric simulations goes something like this:
Q: "Why do I get a flat line variation of energy consumption/CO2/max temperature when running parametric analyses"
A: The usual reason for parametric analysis generating a flat line variation is that there is no clear data inheritance path from the building level (where the parametric changes are applied) down to the individual zones/surfaces. For example, when using Window to wall% as a variable, you should make sure that:
Q: "Is it possible to change the intervals for variables? For example is it possible to change "Window operation %" range from 20, 40, 60... to 10, 20, 30, 40..."
A: In the current version of the software there is no way to modify the intervals but this will be allowed in future versions.